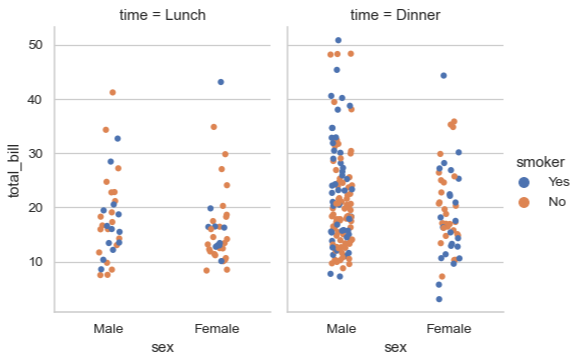
What is seaborn.stripplot?
Seaborn is a widely used library for the visualization of statistical plots in python. Its simple API makes life easier and allows plots to be created in a timely manner. It offers a variety of color palettes and statistical styles to make plots more appealing. Since Seaborn is built on top of the matplotlib.pyplot library, it can easily be linked with libraries (e.g., pandas).
A strip plot is very simple to understand. It is basically a scatter plot that differentiates different categories. So, all the data that corresponds to each category is shown as a scatter plot, and all the observations and collected data that are visualized are shown, side-by-side on a single graph.
Strip plots are considered a good alternative to a box plot or a violin plot.
Syntax
seaborn.stripplot(
x=None,
y=None,
hue=None,
data=None,
color=None
)
Parameters
x: Data for x-axis. There is no specified type for x; so, it is important to define it if someone is looking for data to be interpreted as
y: Data for y-axis. There is no specified type for y. It is important to define it if someone is looking for data to be interpreted as long-form.
hue: Another one of the inputs for plotting any type of long-form data. This parameter is used to determine the column that will be used for color encoding.
data: Dataset to be used for plotting. The format of data can include:
- array/ list of vectors.
- Vectors of data in the form of lists, numpy arrays, or pandas Series objects.
- A pandas DataFrame. However, it is important to define the
x,y, andhuevariables to easily identify how data should be plotted from DataFrame.
color: Refers to the individual colors of all elements for a gradient palette.
The function returns the corresponding plot.
Code
Let’s draw a few scatter plots, with Iris dataset, that compare all three species types with their respective sepal_width, sepal_length , and petal_length.
# import librariesimport seaborn as snsimport matplotlib.pyplot as plt# load the iris datasetdf = sns.load_dataset('iris')# use sns for striplot# the column of sepcies is used as x.# the column of sepal_width is used as y.# the data is the iris dataframe.sns.stripplot(x=df["species"], y=df["sepal_width"], data=df)plt.show()
One can always add a title, xlabel, or ylabel using the matplotlib functions of
plt.xlabel,plt.ylabel, andplt.title.
import seaborn as snsimport matplotlib.pyplot as pltdf = sns.load_dataset('iris')sns.stripplot(x=df["species"], y=df["sepal_length"], data=df)plt.xlabel("species")plt.ylabel("sepal length")plt.show()
import seaborn as snsimport matplotlib.pyplot as pltdf = sns.load_dataset('iris')sns.stripplot(x=df["species"], y=df["petal_length"], data=df)plt.show()
Free Resources

