What is seaborn.pairplot?
Overview
Seaborn is a data visualization library in Python that provides various functions for different charts and plots.
Refer to Seaborn library in Python to learn more about seaborn.
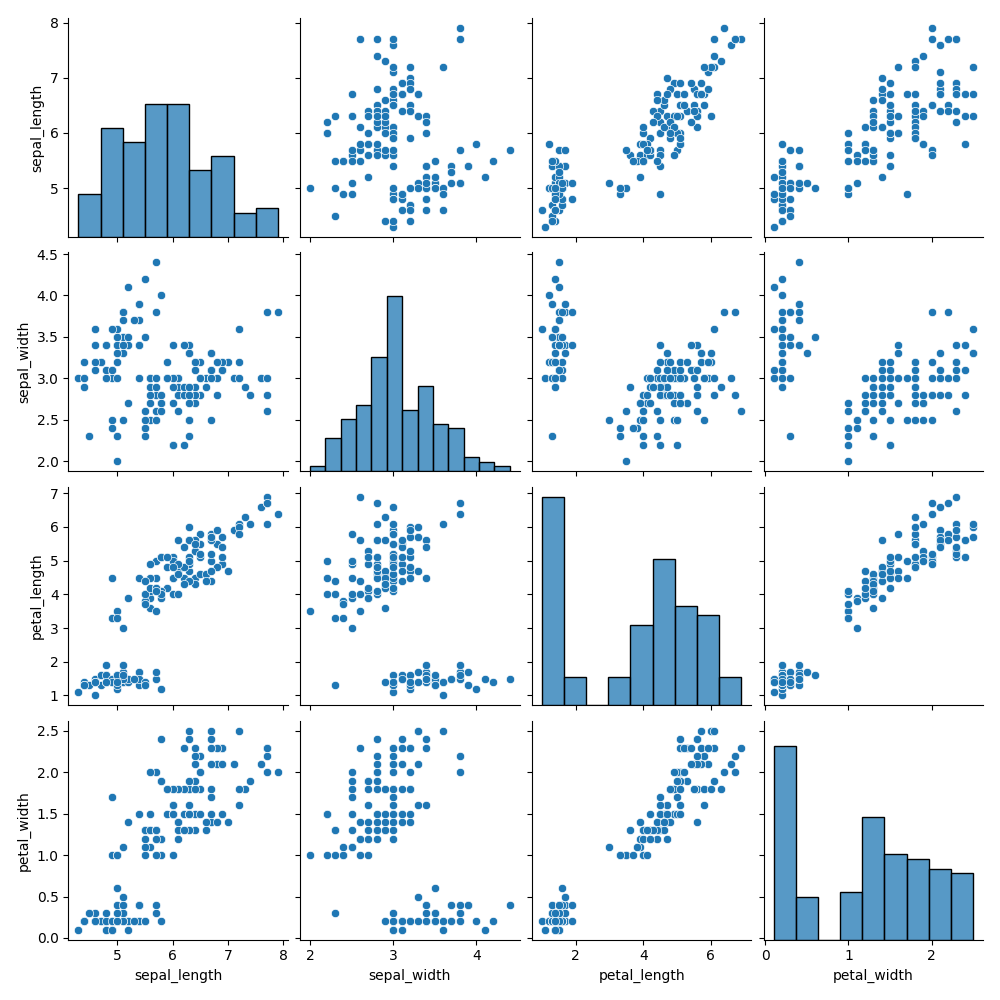
A pair plot is a plot of subplots where each subplot represents a bivariate distribution of two variables in the given dataset.
Here is an example of a pair plot for the iris dataset:
Iris dataset
Syntax
seaborn.pairplot(data, hue=None, x_vars=None, y_vars=None, kind='scatter', diag_kind='auto', dropna=False)
Parameters
data: This is a pandas DataFrame where each column is a variable and each row is an observation.hue: This is a variable in data to map to different colors.x_vars,y_vars: These are the variables in the data to be used separately for the rows and columns of the plot.kind: This is the kind of plot to be made. Its values can bescatter,kde,hist, orreg.diag_kind: This is the kind of plot for the diagonal subplots. Its values can beauto,hist,kde, orNone.dropna: This is a boolean value that indicates whether to drop the missing values before plotting.
Example
import seaborn as snsimport matplotlib.pyplot as plttaxis = sns.load_dataset("taxis")p_plot = sns.pairplot(taxis)plt.savefig("output/plot.png")
Explanation
- Lines 1–2: We import the
seabornandmatplotliblibraries. - Line 4: The
seabornlibrary provides a predefined set of datasets. The different datasets can be found in seaborn datasets. One such dataset is the taxis dataset. The dataset is loaded into memory using theload_dataset()function. - Line 6: A pair plot is created using the
pairplot()for the taxis dataset. - Line 8: The plot is saved to the local disk as
plot.png.
Free Resources
Copyright ©2025 Educative, Inc. All rights reserved
