What is RAPTOR?
RAPTOR is a flowchart interpreter that is used to draw flowcharts and help students visualize their algorithms. It was designed in 2015 by Martin C. Carlisle, and is only supported in Windows OS.
How to install Raptor
- Go to this link
- Click on Download latest Version
- Click on Run
- Welcome Wizard appears, click on Next
- Select the installation folder
- Confirm Installation of Raptor by clicking on Next
Overview of Raptor
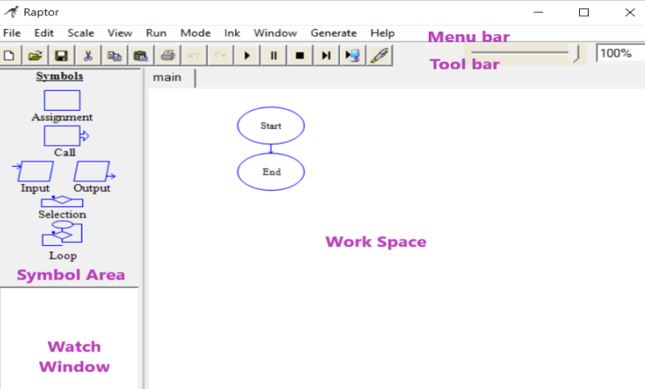
Raptor window contains four main areas, namely:
- Symbol Area
- Watch Window
- Work Space
- Menu and Toolbars
1. Symbol area
Symbol Area has 6 graphical symbols namely Assignment (to change the value of a variable), Call ( to invoke procedures), Input (to take input from users), Output (to display output in the master console window), Selection (for decision making), and Loop control (to repeat a sequence of steps). All we need to do is drag these symbols and place them in the workspace. We will choose the required symbol based on the logic of the problem we are using to draw the flowchart.
2. Watch window
The Watch Window gives users feedback on the values of all variables and arrays as a flowchart executes.
3.Work space
In the Workspace, we draw and execute flowcharts.
4. Menu and Toolbars
These bars help users to change settings and control the view and execution of individual flowcharts.
Example
Draw a flowchart to add three given numbers.
