What is Ember Inspector and how is it used?
Ember is a powerful JavaScript framework that you can use to build web applications. It comes loaded with everything you need to build engaging
The Ember Inspector is a browser extension (or add-on) that we can use to understand and debug ember applications.
After downloading and enabling the Ember Inspector, you will see the ember tab in the developer tools (dev tools) window.
Major components
There are several components to the Ember Inspector that you can use to better understand and debug your application.
For a detailed explanation, you can read more about the Ember Inspector from the official ember guide here.
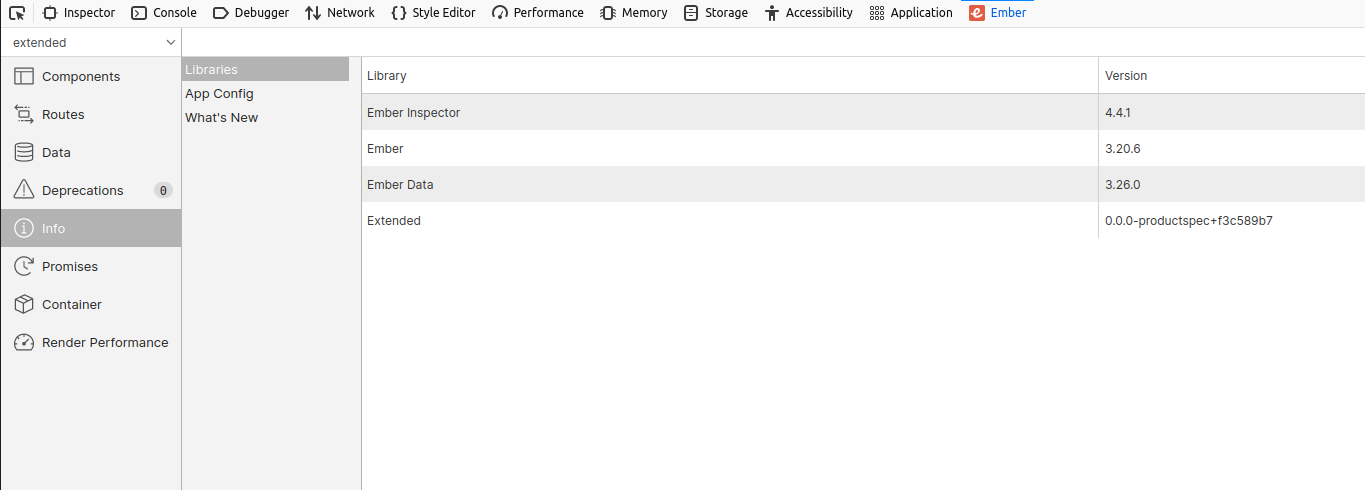
1. Info tab
The Info tab shows the current versions of the libraries used within the application.
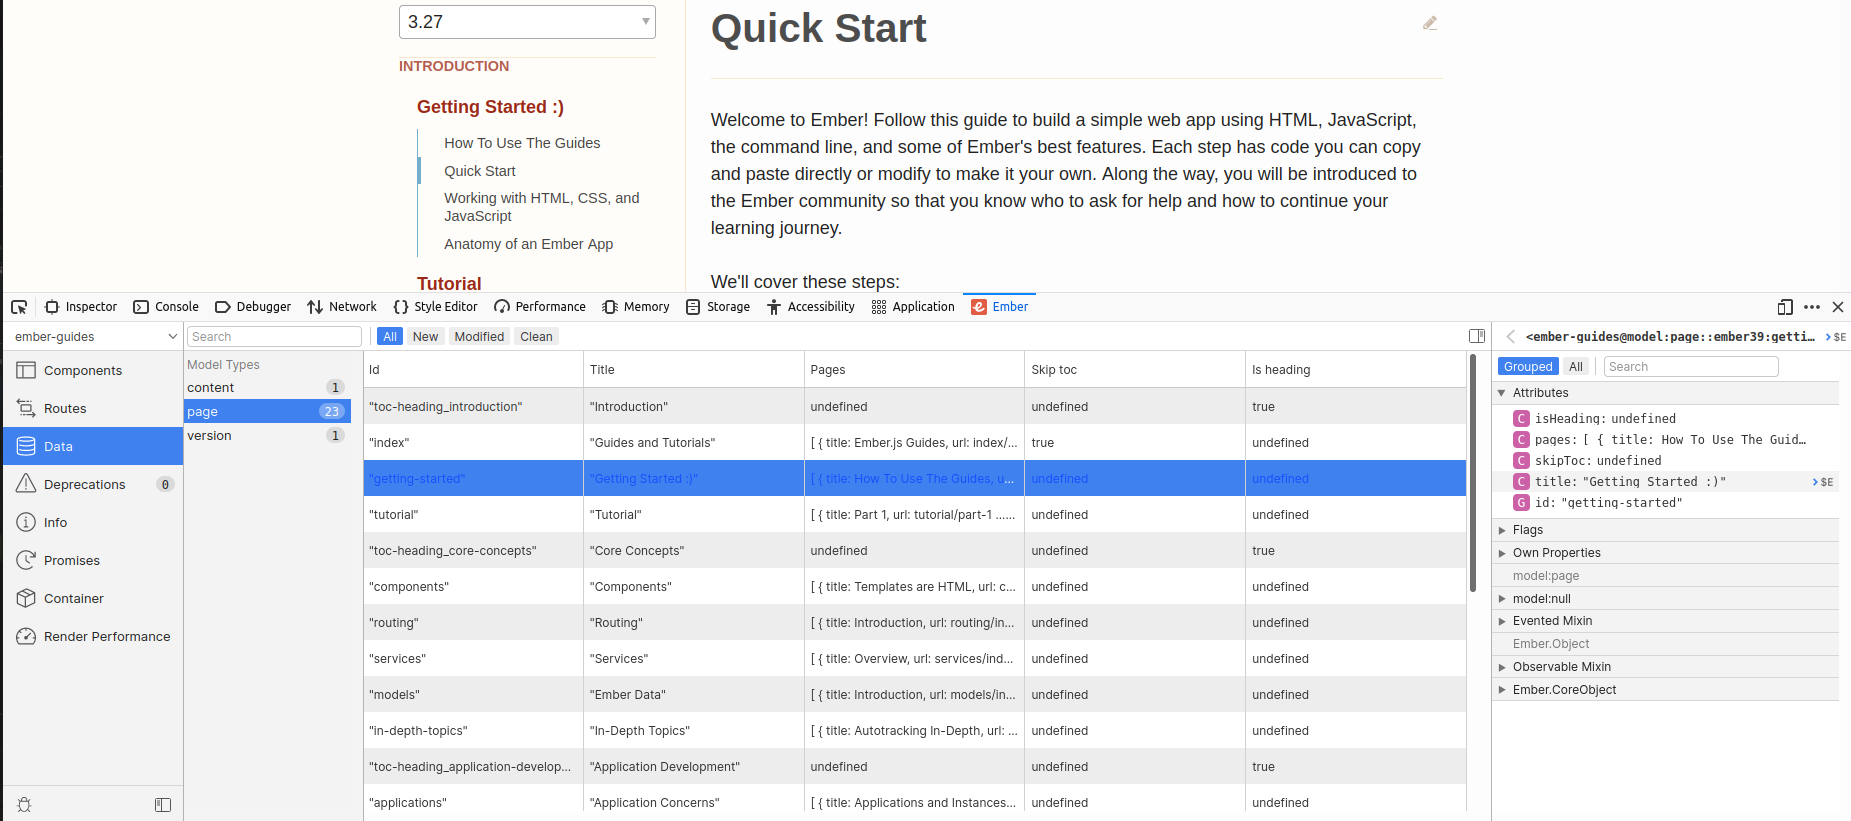
2. Data tab
The Data tab shows all the ember data models used within the app. We can use it to inspect models, navigate relationships between models, and update model data.
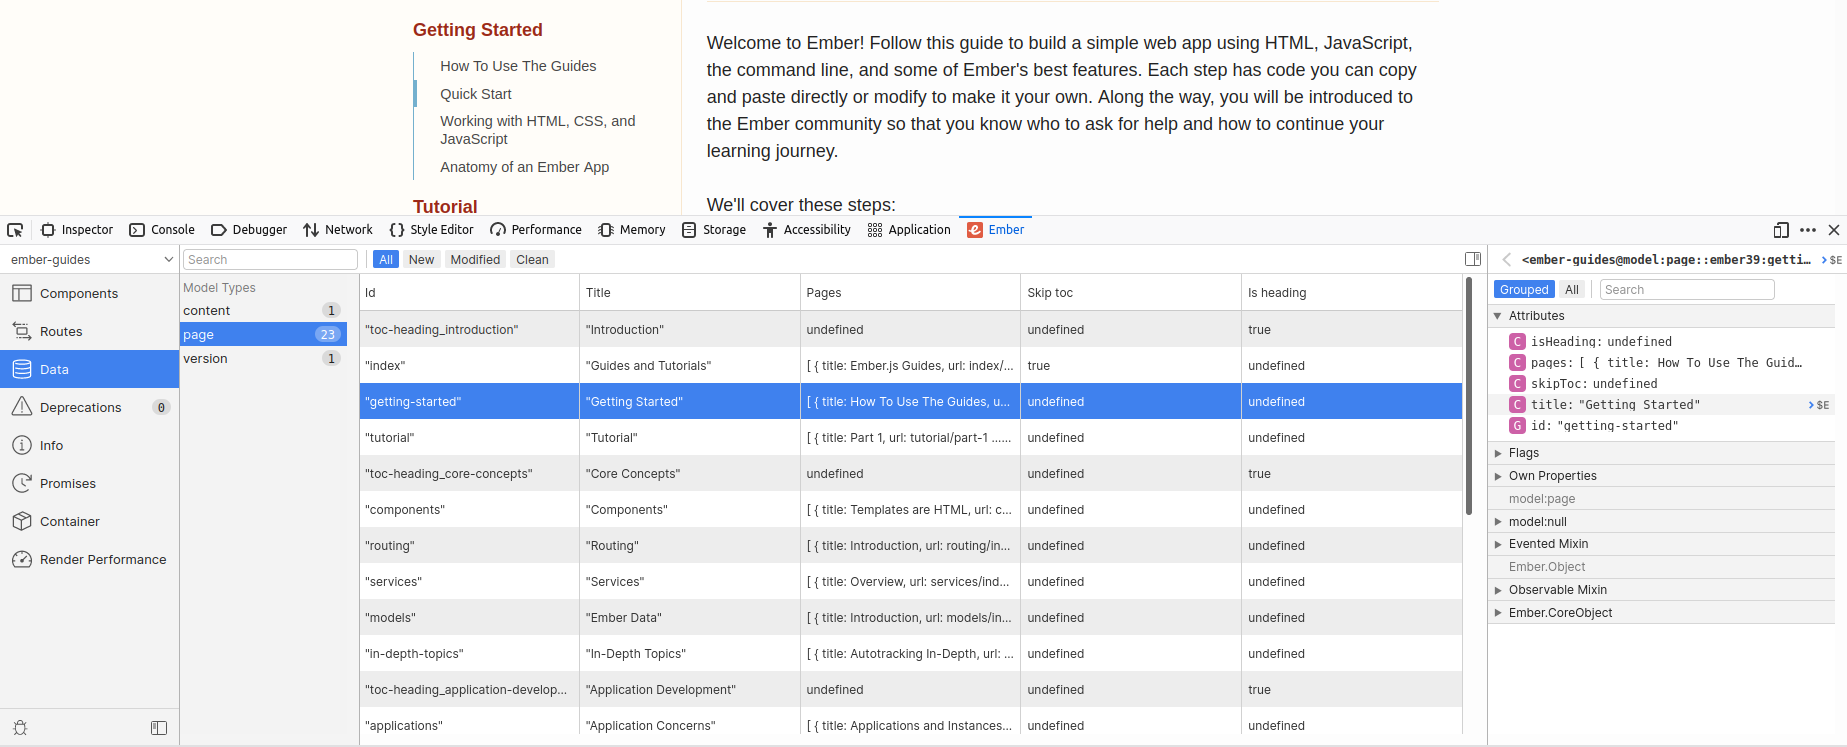
The app UI live updates as you make changes to the model data.
3. Routes tab
The Routes tab shows all the routes in your application. There may be many routes in the app, but we can filter on current routes to see currently active routes exclusively.
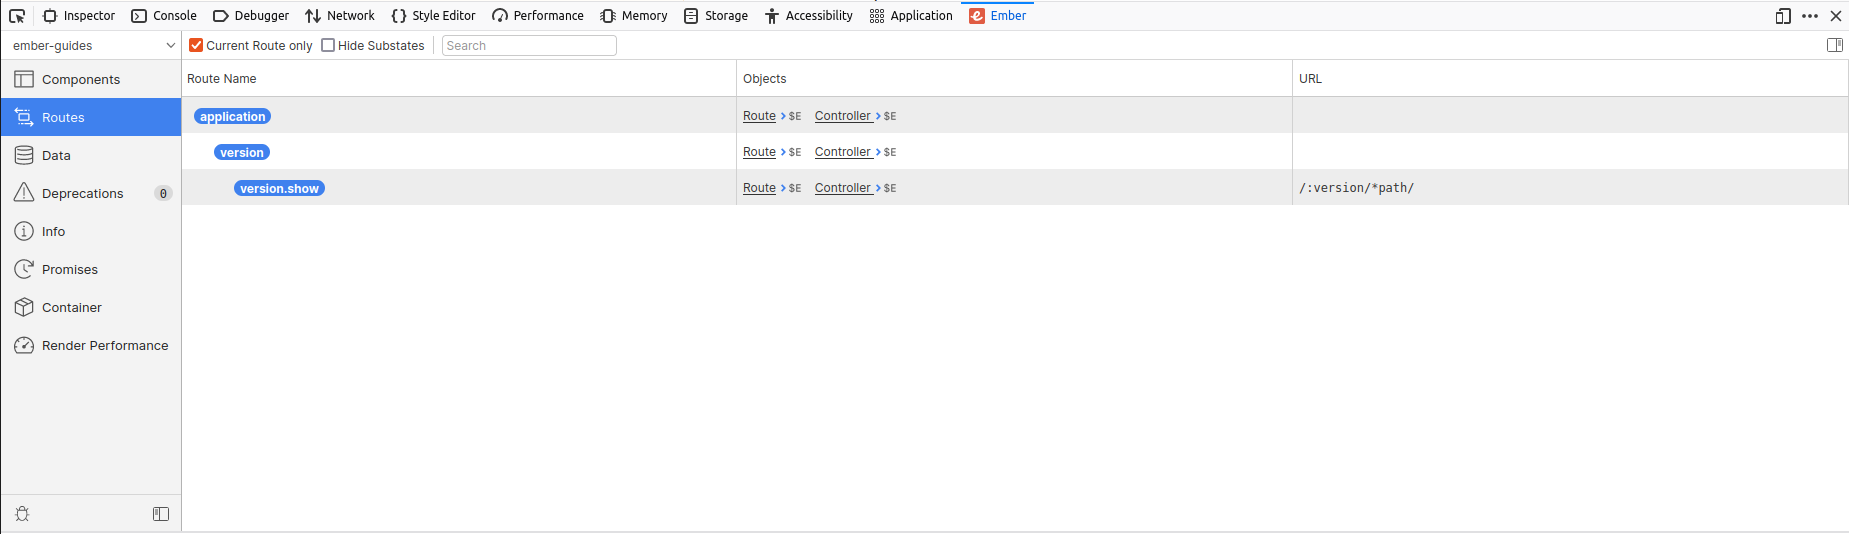
Clicking on a route or a controller will open up the Object Inspector where we can inspect or manipulate an object.
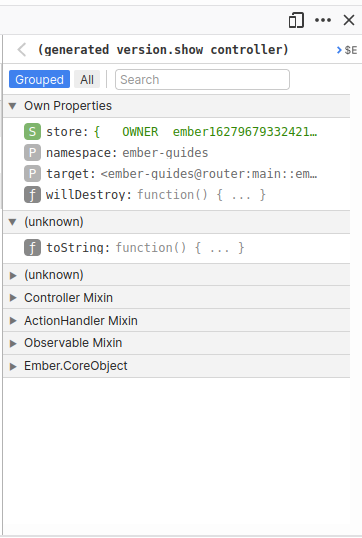
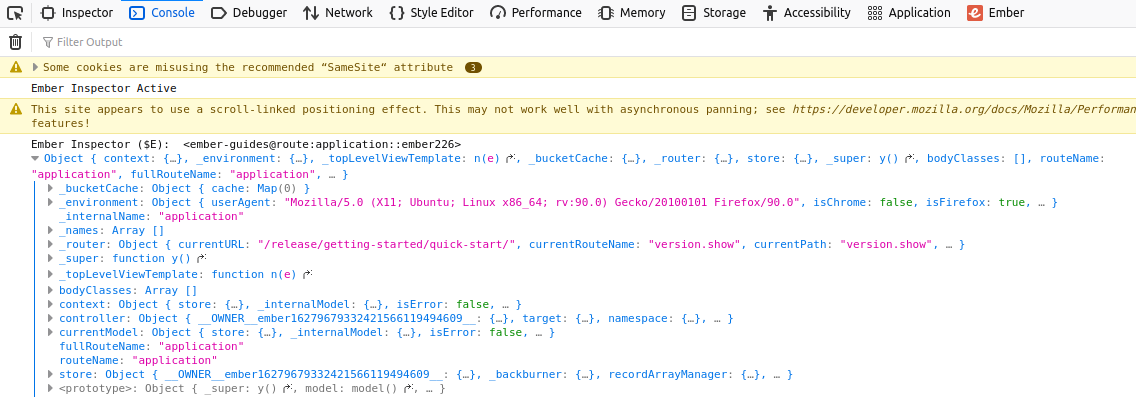
Clicking on $E sends the object to the console. Here, you can expand the object for a much more detailed analysis.
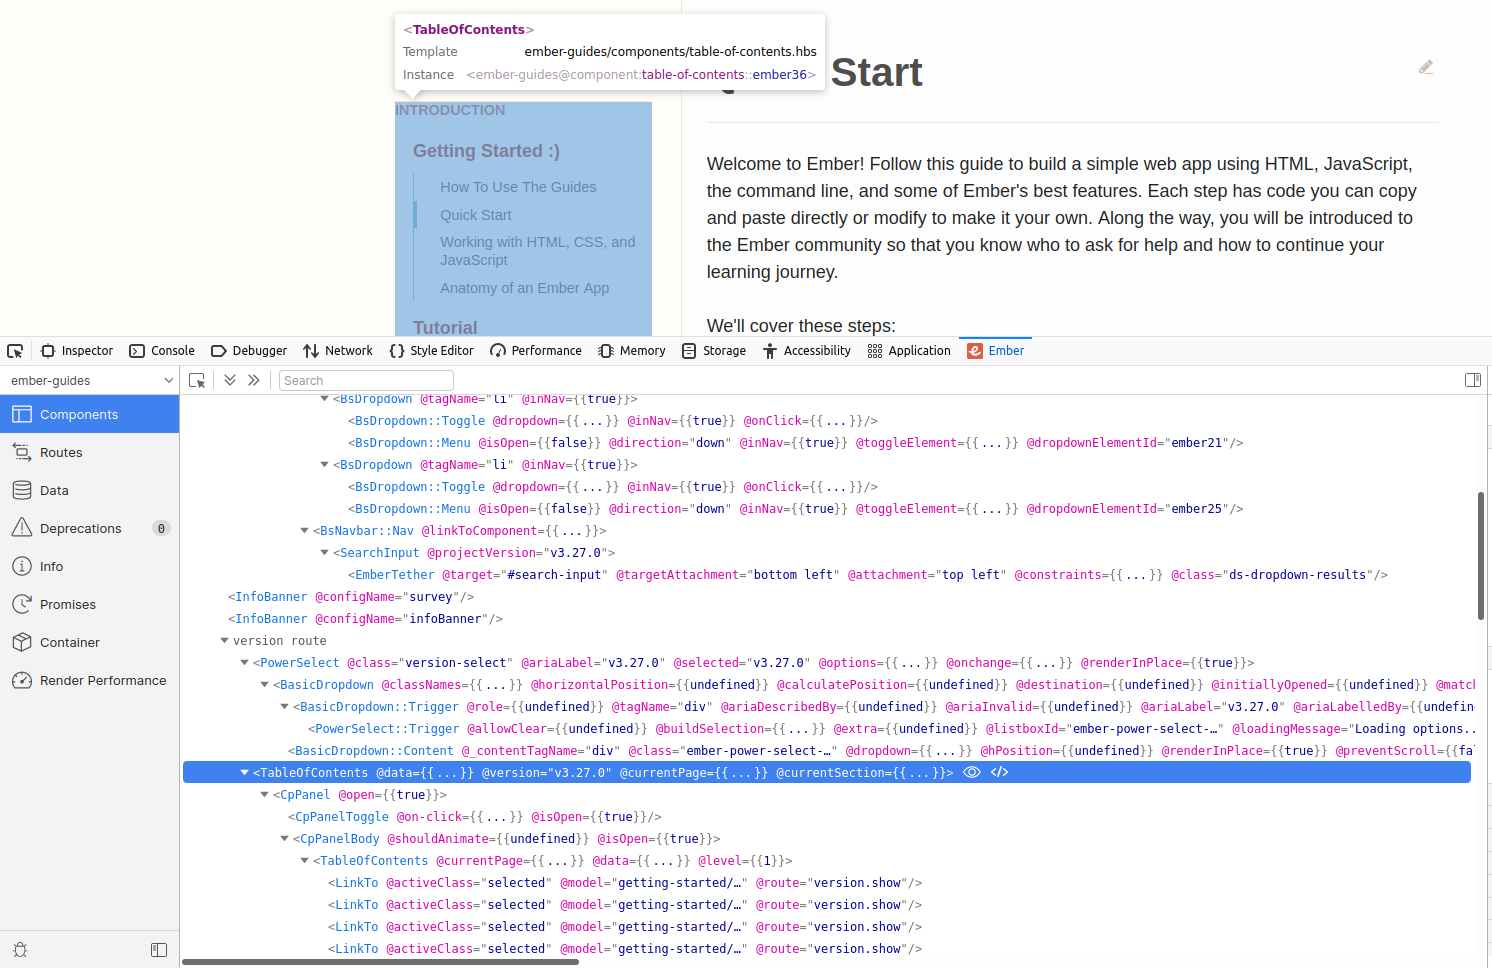
4. Components tab
The Components tab shows the currently rendered components of the app. When you click a component, it is highlighted on the application.
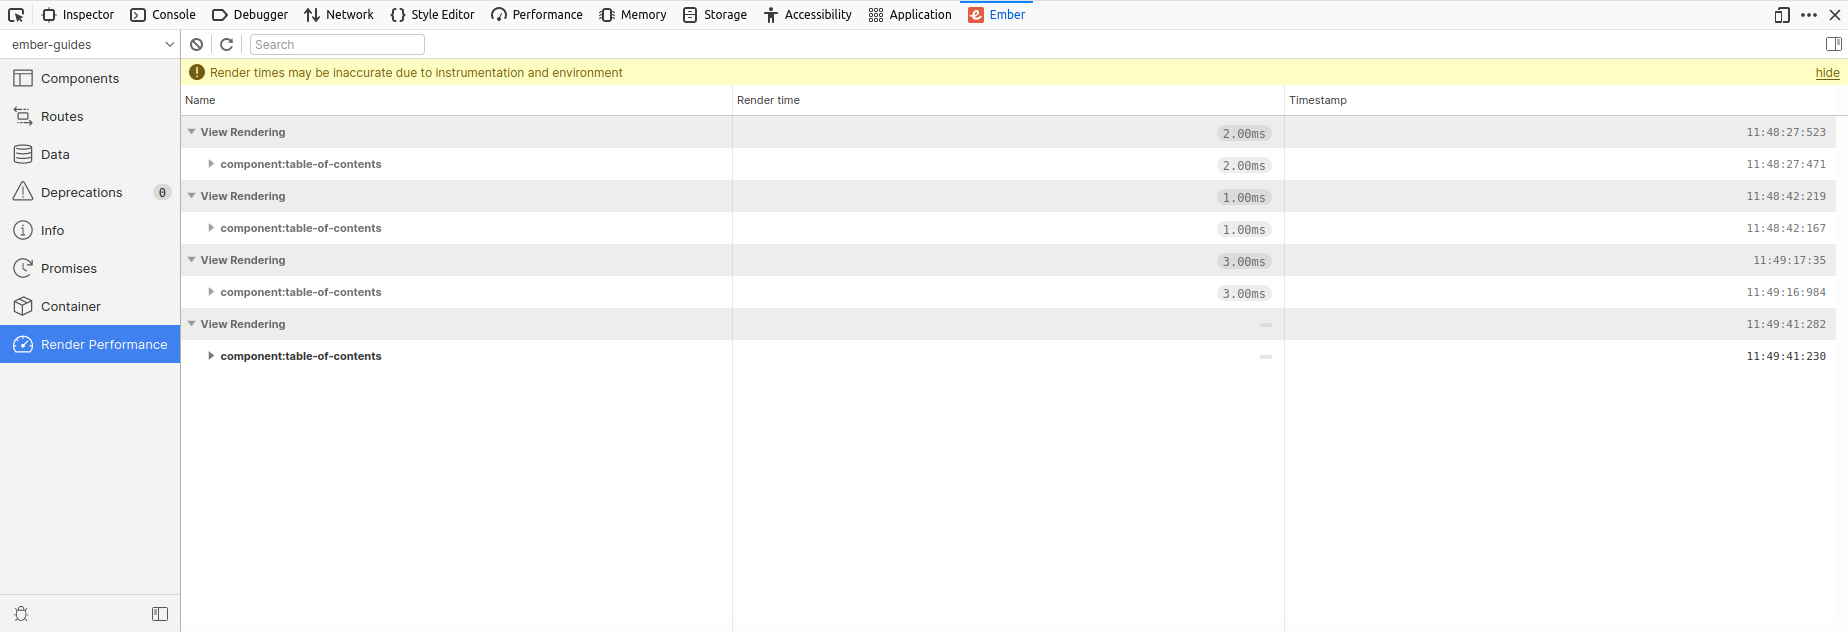
5. Render performance tab
The Render Performance tab gives us access to useful render time metrics. These can help us compare relative render times or identify potential render bottlenecks.
Free Resources