How to implement Linear Regression in Python
Linear Regression is a Machine Learning algorithm that helps predict the outcome of a system using some initial conditions.
For example, let’s say we have a car. Can we tell what the co2 emission of the car is based on the size of its engine?
With linear regression, we can find the relationship between these two parameters.
To do this, we must first train a linear regression model using a large data set that contains engine sizes and co2 emissions.
Before we move on, let’s visualize the data. Here, we are using modules called matplotlib, pandas, and numpy.
matplotlib is a popular Python plotting library, while pandas and numpy are used for data manipulation and analysis.
To learn more about
matplotlib, check out this answer.
Start by importing the modules:
import pandas as pd
import numpy as np
import matplotlib.pyplot as plt
Visualize the data
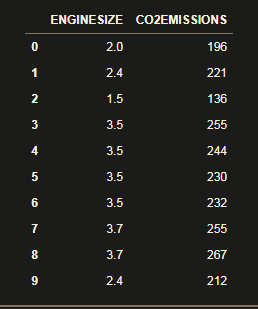
Now, we will import the csv file with all our data, give it to a variable called data, and visualize the first 10 rows using data.head(10):
data=pd.read_csv("Fuel.csv")
data.head(10)
If you run this code, you will see:
Now, select only the size and emission data:
data = data[["ENGINESIZE","CO2EMISSIONS"]]
And visualize the data:
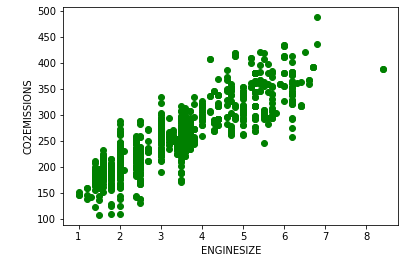
plt.scatter(data["ENGINESIZE"] , data["CO2EMISSIONS"] , color="green")
plt.xlabel("ENGINESIZE")
plt.ylabel("CO2EMISSIONS")
plt.show()
In the code above, we are using the scatter() function to create a scatter plot graph between engine size and co2 emissions, and then labeling the x and y-axis. You can the show() function to output the graph and, if you run this code, you’ll get:
Now that we have visualized the data, it’s time to create a linear regression model.
The model predicts the value of yx
The relationship between these two values is determined by its regression coefficient (represented by m).
So, we can call this the change in y with regard to the change in x and represent it between the two values as a straight line (i.e., this is the slope of the line).
From the slope-intercept formula, y = mx +c we can figure out the change in y with regard to the change in x. However, in Machine Learning we do not know the exact values of m and c, so we call them parameters and aim to find values that best fit the given system.
How to import a linear model
We use a module called sklearn to create a linear regression model:
from sklearn import linear_model
Generate training and testing data from our data
train = data[:(int((len(data)*0.8)))]
test = data[(int((len(data)*0.8))):]
We are using 80% of our data for training and 20% for testing.
Modeling
In the code below, we are making a liner regression model in regr
using the training data:
regr = linear_model.LinearRegression()
train_x = np.array(train[["ENGINESIZE"]])
train_y = np.array(train[["CO2EMISSIONS"]])
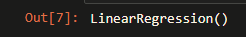
regr.fit(train_x,train_y)
If you successfully create the model, your output will be:
Coefficients
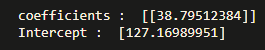
No, lets look at the coefficients:
print ("coefficients : ",regr.coef_) #Slope
print ("Intercept : ",regr.intercept_) #Intercept
Your output should be:
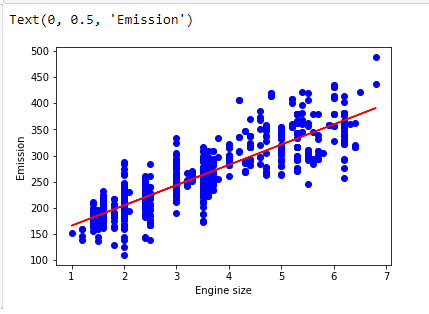
Plotting the regression line
Use the following code to plot the regression line:
plt.scatter(train["ENGINESIZE"], train["CO2EMISSIONS"], color='blue')
plt.plot(train_x, regr.coef_*train_x + regr.intercept_, color='red')
plt.xlabel("Engine size")
plt.ylabel("Emission")
Now, let’s do some predictions:
The function for predicting future values is:
def get_regression_predictions(input_features,intercept,slope):
    predicted_values = input_features*slope + intercept
    return predicted_values
So, in order to predict the emissions of a future car, use:
my_engine_size = 2
estimatd_emission = get_regression_predictions(my_engine_size,regr.intercept_[0],regr.coef_[0][0])
print ("Estimated Emission :",estimatd_emission)
Output:

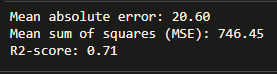
To check for various accuracy:
from sklearn.metrics import r2_score
test_x = np.array(test[['ENGINESIZE']])
test_y = np.array(test[['CO2EMISSIONS']])
test_y_ = regr.predict(test_x)
print("Mean absolute error: %.2f" % np.mean(np.absolute(test_y_ - test_y)))
print("Mean sum of squares (MSE): %.2f" % np.mean((test_y_ - test_y)** 2))
print("R2-score: %.2f" % r2_score(test_y_ , test_y) )
Output:
Congratulations
You have successfully learned to construct and train a linear regression model.