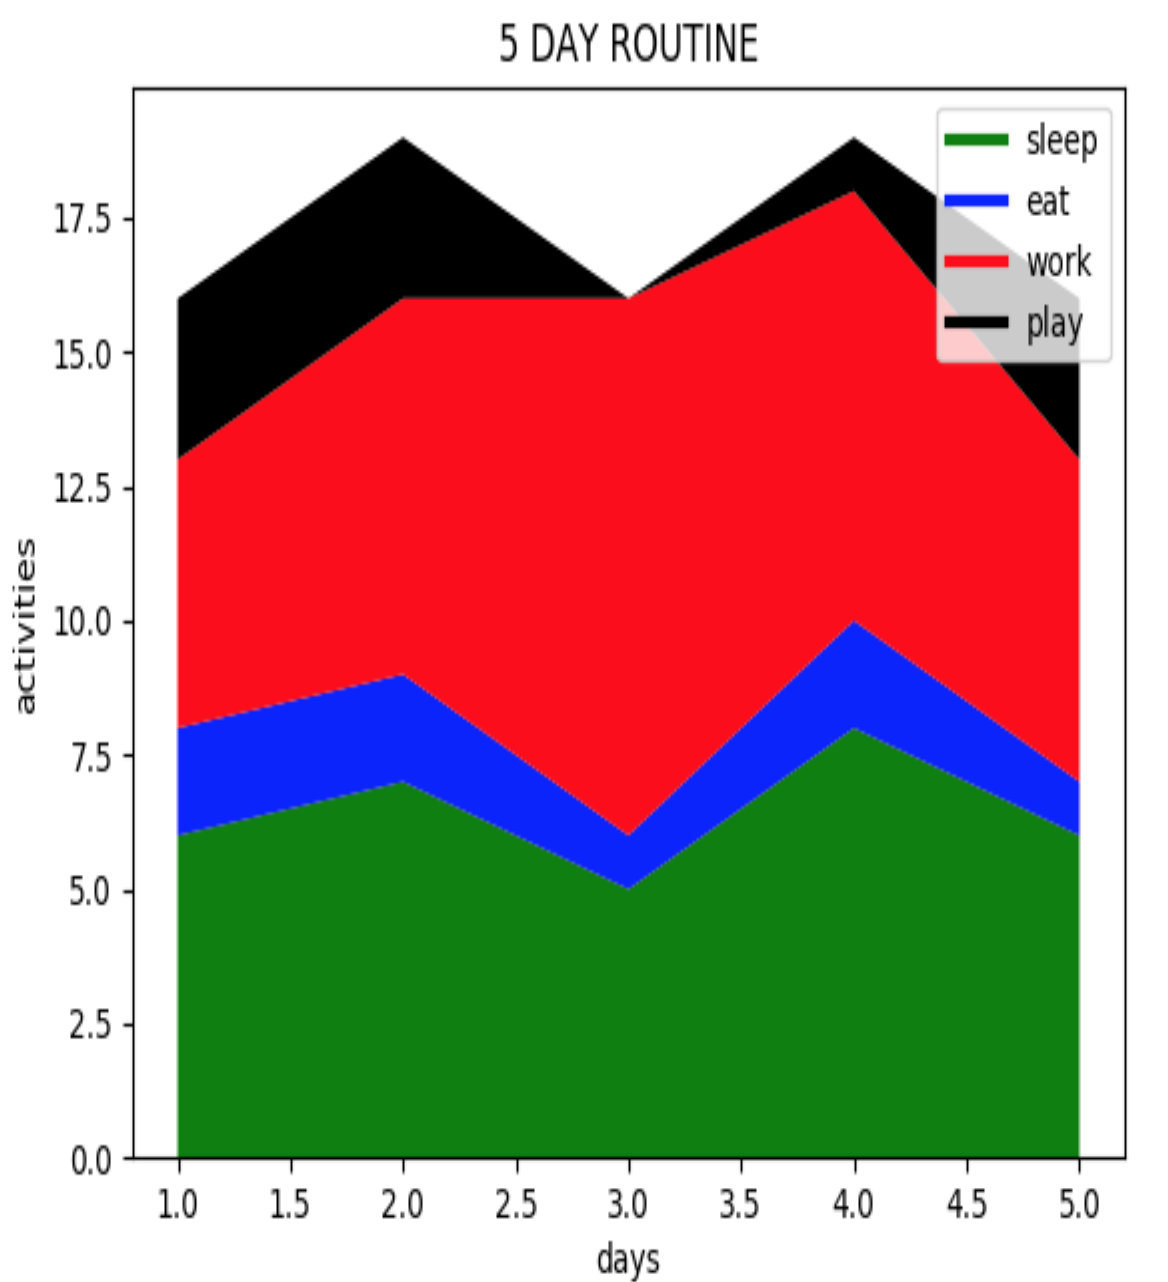
Pandas provides a convenient way to create stacked plots directly from DataFrames. You can use the plot function with the kind='bar' and stacked=True arguments:
import pandas as pd
import matplotlib.pyplot as plt

# Sample DataFrame
data = {'Category': ['A', 'B', 'C'],
        'Value1': [10, 20, 30],
        'Value2': [15, 25, 15]}
df = pd.DataFrame(data)

# Create the stacked bar plot
df.plot(kind='bar', stacked=True)

plt.xlabel('Categories')
plt.ylabel('Values')
plt.title('Stacked Bar Chart')

plt.show()
